You're reading the documentation of the v0.11. For the latest released version, please have a look at v1.2.
pdisplay
Also known as “Perceval pretty display”, is a generic function designed to display a lot of different types of Perceval objects.
Display a circuit
Any circuit coded in perceval can be displayed. You just need to make the code associated with the desired circuit, let’s call it circ, and add pcvl.pdisplay(circ) afterwards in the python cell.
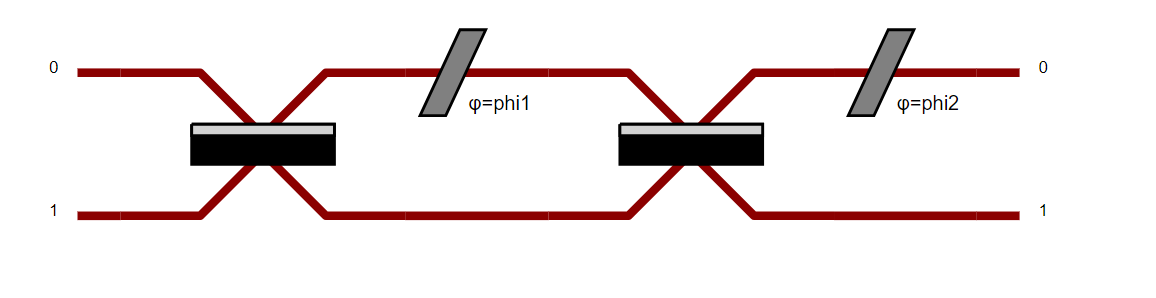
Let’s do an example to understand : you want to display the Mach-Zendher Interferometer.
Start by doing the code associated to the circuit.
>>> import perceval.components.unitary_components as comp
>>> mzi = (pcvl.Circuit(m=2, name="mzi")
...        .add((0, 1), comp.BS())
...        .add(0, comp.PS(pcvl.Parameter("phi1")))
...        .add((0, 1), comp.BS())
...        .add(0, comp.PS(pcvl.Parameter("phi2"))))
Then, add pcvl.pdisplay() of your circuit.
>>> pcvl.pdisplay(mzi)
Tip
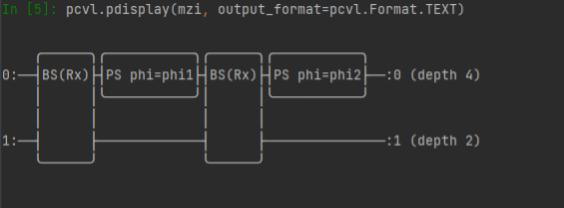
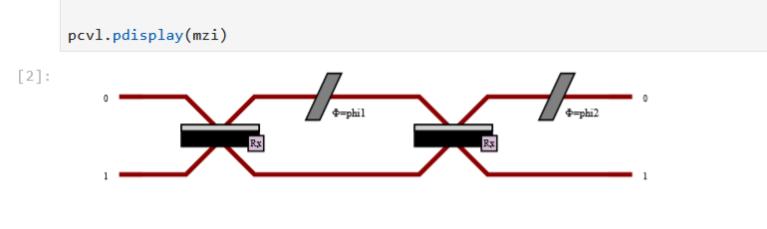
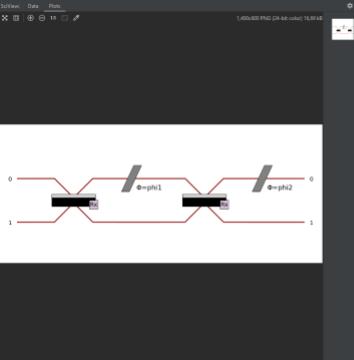
The outcome of this last command will depend on your environment.
Text Console |
Jupyter Notebook |
IDE (Pycharm, Spyder, etc) |
|---|---|---|
|
|
|
Also, you can change the display of the circuit using a different skin which can itself be configured. Indeed, a boolean can be set to obtain a more compact display (if the circuit is too wide for example).
>>> import perceval as pcvl
>>> import perceval.components.unitary_components as comp
>>> from perceval.rendering.circuit import SymbSkin
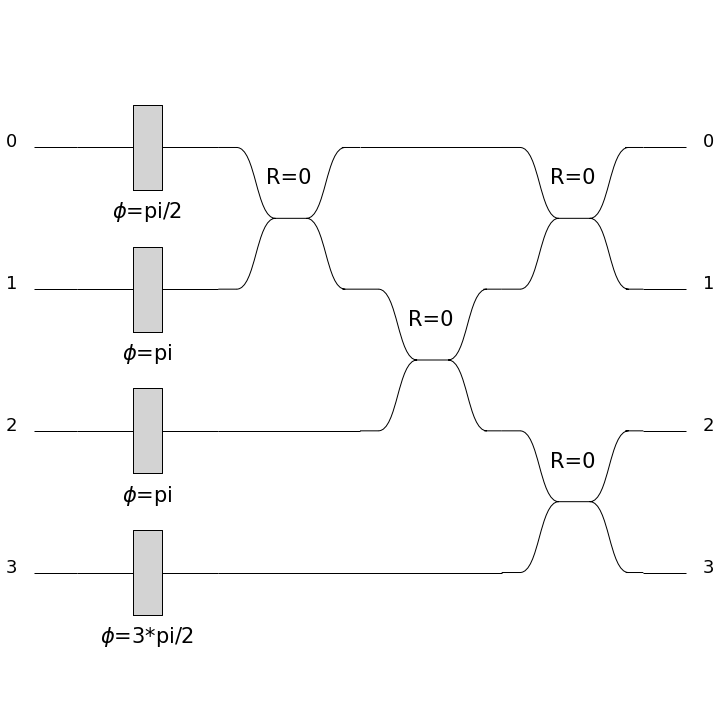
>>> C = pcvl.Circuit.decomposition(pcvl.Matrix(comp.PERM([3, 1, 0, 2]).U),
>>> comp.BS(R=pcvl.P("R")), phase_shifter_fn=comp.PS)
>>> symbolic_skin = SymbSkin(compact_display=True)
>>> pcvl.pdisplay(C, skin=symbolic_skin)
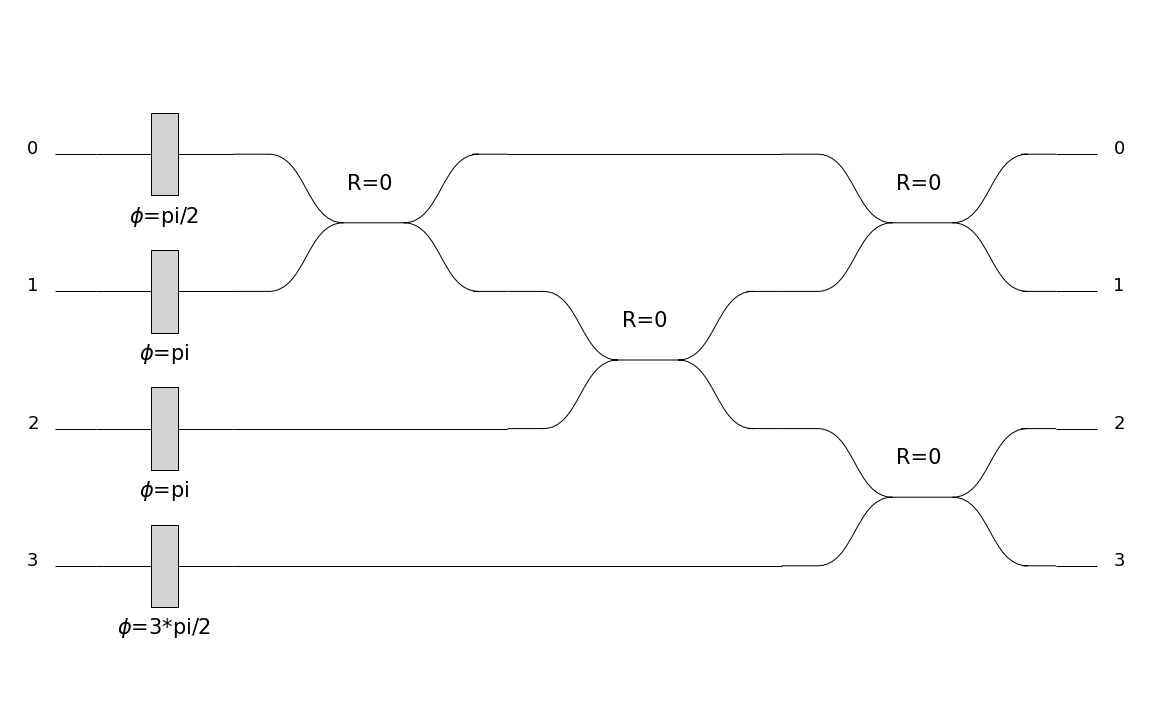
>>> symbolic_skin = SymbSkin(compact_display=False)
>>> pcvl.pdisplay(C, skin=symbolic_skin)
Code reference
- perceval.rendering.pdisplay.pdisplay(o, output_format=None, **opts)
Pretty display Main rendering entry point. Several data types can be displayed using pdisplay.
- Parameters:
o – Perceval object to render
output_format (
Optional[Format]) – Format controls where and how a figure is render (in a interactive window, the terminal, etc.) - MPLOT: Matplotlib drawing (default in IDE - spyder, pycharm or vscode) - HTML: HTML for data table, SVG for circuits/processors (default in notebook) - TEXT: Pretty text display (default in another cases) - LATEX: LaTex code, drawing with Tikz for circuits/processors
- opts:
skin (rendering.circuit.PhysSkin, SymbSkin or DebugSkin or any ASkin subclass instance):
Skin controls how a circuit/processor is displayed:
PhysSkin(): physical skin (default),
DebugSkin(): Similar to PhysSkin but modes are bigger, ancillary modes are displayed, components with variable parameters are red,
SymbSkin(): symbolic skin (thin black and white lines).
precision (float): numerical precision
nsimplify (bool): if True, tries to simplify numerical values by searching known values (pi, sqrt, fractions)
recursive (bool): if True, all hierarchy levels in a circuit/processor are displayed. Otherwise, only the top level is drawn, others are “black boxes”
max_v (int): Maximum number of displayed values in distributions
sort (bool): if True, sorts a distribution (descending order) before displaying
render_size: In SVG circuit/processor rendering, acts as a zoom factor (float) In Tomography display, is the size of the output plot in inches (tuple of two floats)
- perceval.rendering.pdisplay.pdisplay_to_file(o, path, output_format=None, **opts)
Directly saves the result of pdisplay into a file without actually displaying it.
- Parameters:
o – Perceval object to render
path (
str) – Path to file to saveoutput_format (
Optional[Format]) – Seepdisplayfor details. Contrarily topdisplay, this method always uses Format.MPLOT by default so you might need to specify it by hand for some kinds of objects.opts – See
pdisplayfor details.